Analytics
Analytics shows how your Meta ads perform: spend, purchases, ROAS and more, for any period, compared with an earlier one. Every number comes from Meta. We import it, add it up and show it; we never estimate a number Meta hasn't reported.
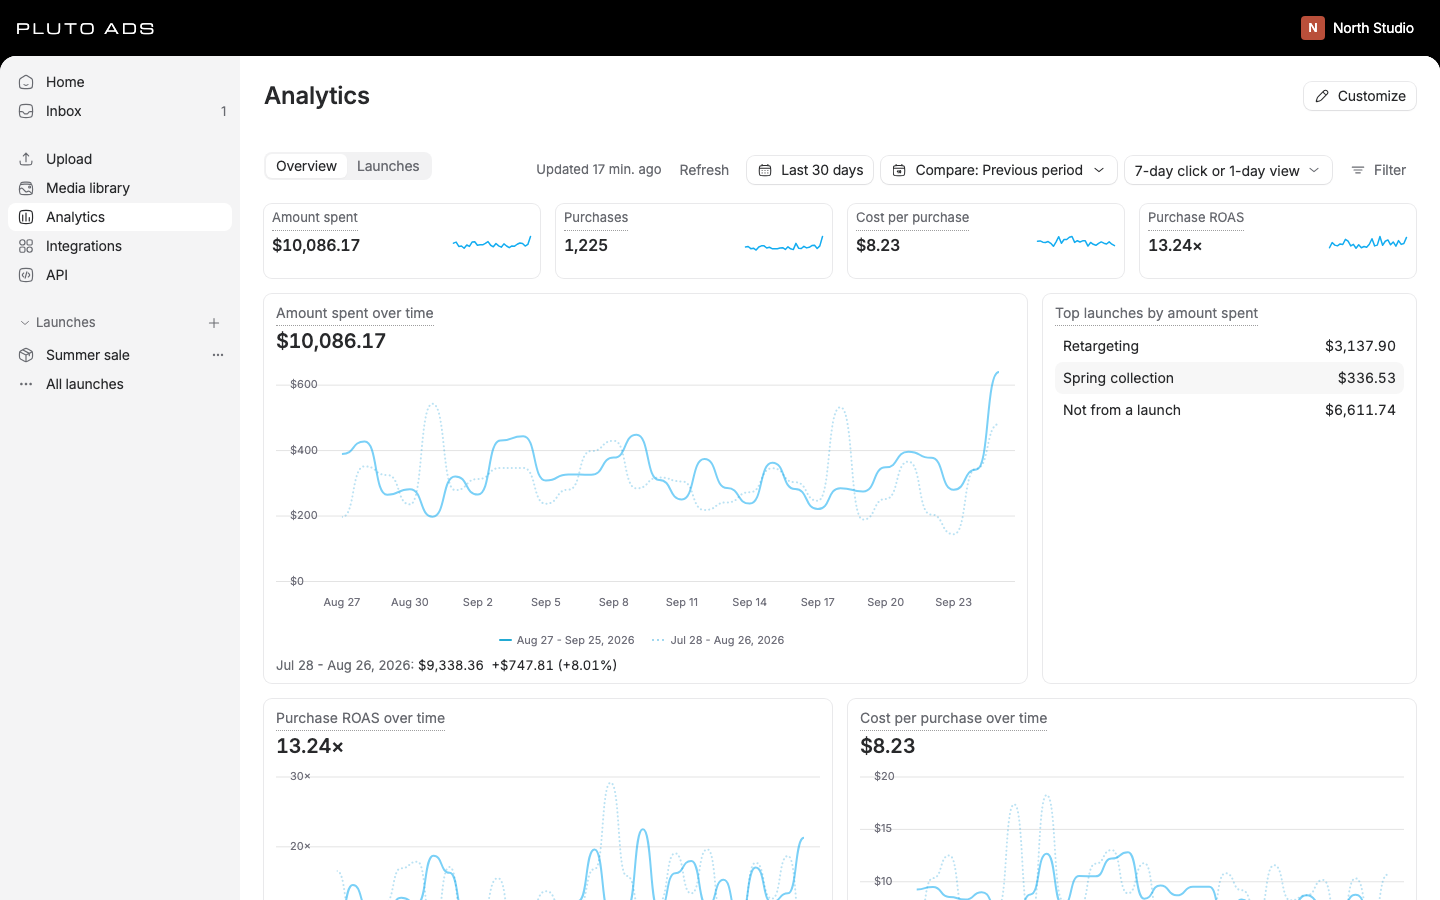
Dashboard
Open Analytics in the sidebar. Overview is the workspace dashboard; Launches lists your launches with what each spent (see Launch results).
Analytics needs a Meta connection. Until then the page says Connect Meta to see performance; see Connect Meta. When Meta is connected but shares no ad accounts with Pluto, it says No ad accounts. The default dashboard has one section, Dashboard:
- Tiles for Amount spent, Purchases, Cost per purchase and Purchase ROAS.
- Charts of amount spent, purchase ROAS and cost per purchase over the period.
- Top launches by amount spent, and Ad set performance with spend, purchases, cost per purchase and ROAS per ad set.
Each card shows the period's value. Larger cards also show the comparison period's value and the change between them; small tiles show the value only. Hover a rounded value to see the exact one, and a card's title for what the metric means and how it's calculated. With more than one section, each section has a header you can collapse.
Period, comparison and attribution
The controls above the dashboard choose what the numbers cover. The dashboard opens on Last 30 days, compared with the 30 days before, with Meta's default attribution.
- Period: presets from Today to Year to date, plus Black Friday and Cyber Monday, or any range you pick.
- Comparison: No comparison, Previous period (the same number of days right before), Previous year (the same dates a year earlier) or Custom.
- Attribution setting: which purchases Meta credits to an ad. 7-day click or 1-day view (Meta's default), 7-day click, 1-day click or 1-day view. Someone who clicks your ad today and buys within 7 days counts under a 7-day click setting; under 1-day click, only if they buy by tomorrow.
The first time anyone picks an attribution setting, we import it from Meta, so its numbers take a few minutes to appear.
Filters
Select Filter to narrow the numbers to one or more Ad account, Campaign, Ad set or Launch values. Applied filters show as chips; the x on a chip removes it, and Clear filters removes all.
The Launch filter lists published launches.
Platform, Placement, Country, Age, Gender and Format are in the menu but disabled: Pluto doesn't import these Meta breakdowns, so a number filtered by them would be wrong. For the same reason, the cards for spend by placement or platform and purchases by age and gender or country say Pluto doesn't import this Meta breakdown yet. (Not imported yet on a small tile) instead of showing a number.
Metrics
Every count comes from Meta. We sum the counts over the ads and days you picked, then compute each ratio from those sums, the way Ads Manager does. We never average ratios.
| Metric | How it's calculated |
|---|---|
| Amount spent, Impressions, Reach, Link clicks, Landing page views, Purchases, Purchase value, ThruPlays | As Meta reports them |
| Frequency | Impressions / Reach |
| CPM | Amount spent / Impressions * 1,000 |
| Link CTR | Link clicks / Impressions |
| Cost per link click | Amount spent / Link clicks |
| Cost per landing page view | Amount spent / Landing page views |
| Cost per purchase | Amount spent / Purchases |
| Purchase ROAS | Purchase value / Amount spent |
| Conversion rate | Purchases / Link clicks |
| Average order value | Purchase value / Purchases |
| Hook rate | 3-second video plays / Impressions |
| Hold rate | ThruPlays / 3-second video plays |
Purchases and purchase value follow the attribution setting you chose. When a ratio has nothing to divide by, such as cost per purchase with no purchases, the card shows no value rather than 0. Link CTR and cost per link click count link clicks only; Meta's own CTR and CPC count all clicks.
Top launches by amount spent can end with a Not from a launch row: spend in your ad accounts that no Pluto launch accounts for, such as campaigns made in Ads Manager. It keeps the rows adding up to the total.
Besides these, the metrics library has Top creatives by purchases, a Purchase funnel from impressions to purchases, and cards by placement, platform, age and gender and country (see Filters for why those show no number).
Currencies
Amounts are always in the ad account's own currency. We never convert currencies, and never add amounts in different currencies together, because any exchange rate we picked would make the totals wrong.
When the ad accounts in view bill in more than one currency, the page says Your ad accounts bill in DKK and EUR. Amounts are shown per currency and never added together. A Currency menu appears next
to the filters: pick one currency to see its amounts, or All currencies (counts only) to see counts
such as impressions and purchases across every account. In that view, money cards say Amounts are
shown per currency. Choose a currency to see this. (Choose a currency on a small tile).
Comparisons
With a comparison chosen, cards larger than a small tile show the comparison period's value and the
change, for example
+$25.05 (+5.01%). Both periods are computed the same way, each from its own sums, so a ratio's change
is the difference between two correctly computed ratios.
- Rates such as CTR and hook rate show only the relative change, since their absolute change would be in percentage points.
- When the earlier value was 0, only the absolute change shows: a percentage of 0 has no meaning.
- When either period has no value, no change shows.
Freshness
Next to the controls, the page says when the numbers were last imported, for example Updated 5 min. ago. With several ad accounts, it shows the least recent one, and adds how many have imported at all while some haven't.
We import new numbers from Meta every hour, right after a Meta sync (at most every 15 minutes), and for a launch's ad account as soon as its ads go live. Meta refreshes its numbers every 15 minutes, so asking more often wouldn't show newer ones.
Refresh imports now instead of at the next hourly run. While it runs, the page shows Importing from Meta... with how many ad accounts are done. If an import is already running, Refresh follows that one instead of starting another. A workspace can start 2 imports every 15 minutes, because each one spends the ad accounts' Meta request budget; beyond that the page says Refreshed recently and when you can refresh again. Refresh needs a role that can edit the workspace.
Numbers that change after the fact
Someone clicks your ad today and buys next week. When they do, Meta credits that purchase back to the day of the click. So recent days aren't final yet. Meta says its numbers stop changing 28 days after they are reported.
We handle this by importing again. Every import re-reads the last 3 days, and once a day we re-read the last 28 days, replacing what we stored. Expect recent purchases and ROAS to rise a little over the following days; older numbers stay put.
History
When you connect Meta, we import the last 90 days first, so the dashboard is useful within minutes. Older days follow in the background, newest first, back to the 37 months Meta keeps.
While that runs, the page says how far back the numbers go, for example History imported back to Mar 2024. Importing older data... A period that reaches further back shows only the days imported so far. If the page says Importing older data is paused., Meta turned down or slowed the last request for older days. We try again on our own, within an hour at most. The note disappears once the history is complete.
Coverage notices
The dashboard tells you when the numbers are incomplete, instead of showing a low number that looks real:
- Not imported from Meta yet, next to the controls: no ad account in view has imported once. It updates on its own.
- Some days aren't imported yet: an ad account is imported through an earlier day. Later days appear after the next import.
- isn't up to date: imports for an ad account are failing, with Meta's reason. If Meta access changed, check the connection in Integrations.
- No delivery in this period: Meta reported no spend for these ad accounts and filters. Try a longer period or clear the filters.
- When Meta needs to be reconnected, the page says new numbers can't be imported until it is.
For every message and what to do, see Troubleshooting.
Launch results
Launches in Analytics lists your launches. Published shows the launches published in the date range you pick (the last 7 days at first), with their ad account, number of creatives, status, date, and the Amount spent and Purchases in that range, with Meta's default attribution. Drafts shows unpublished ones with Open launch. Filter by ad account, search by launch or campaign name, and sort by Newest first or Most creatives. Expand a published launch's row and choose View results.
A launch's results cover its whole delivery, from its first day to its last, with Meta's default attribution. The page shows:
- Tiles for Amount spent, Purchases, Cost per purchase, Purchase ROAS, Purchase value, Impressions, Link CTR and Cost per link click.
- Amount spent over time, and Ad sets with each ad set's results.
- The launch's publishing state, such as Published or Partly published, and how many of its ads are in each delivery status in Meta, such as Active or Paused.
Until the launch delivers, the page says why: Not published yet, Importing results from Meta, Not imported from Meta yet or No delivery reported yet. Open launch takes you to the launch itself; publishing is covered in Publishing.
Customizing the dashboard
The dashboard layout belongs to the workspace: everyone sees the same one. Select Customize to change it (this needs a role that can edit the workspace).
- The sidebar becomes the metrics library, grouped into Delivery, Engagement, Conversions, Video and Breakdowns. Select a metric to add it, or drag it into place.
- Drag cards to move them, drag a card's corner to resize it, and remove cards you don't need.
- Add section adds a titled group of cards; select a section's title to rename it. Reorder sections moves sections up and down.
- Reset to default puts the default layout back in your draft, after asking. Deleting a section asks first too.
Your changes are applied when you select Save dashboard, all at once and for everyone in the workspace. Until then, nobody else sees them. Cancel (or Esc) leaves the layout as it was. If you have changes you haven't saved, Cancel, going back or closing the tab asks Discard changes? first: choose Discard changes or Keep editing.
If a teammate changes the dashboard while you edit, selecting Save dashboard says Someone changed this and saves nothing. Choose Keep my layout to replace theirs, Use their layout to drop your changes and continue from theirs, or Review their layout to see theirs first.
Good to know
- A number Meta hasn't reported is blank, never 0.
- Filters, the period, the comparison, the attribution setting and the currency choice aren't saved: the dashboard opens on the last 30 days each time.
- Pluto doesn't import Meta's breakdowns by platform, placement, country, age, gender and format, so Analytics can't filter or chart by them.
- The Agent and connected agents read the same numbers, refresh them and read launch results through the API and MCP; see the tool catalogue and the route index. An agent that changes the dashboard replaces the whole layout in one save, like Save dashboard, and it's refused if someone saved in the meantime.